
Usage Analytics and Audit Trail
Count what the fleet did over any period, then drill into a searchable record of who did what, where and with what result.
These images are illustrations of the concept, not screenshots of the actual product.
Overview
Usage analytics and audit trail is the VibeControls concept for understanding what a workspace has actually done. The analytics page turns fleet activity into counts over a chosen period, and the audit log records each individual operation with its actor, resource and outcome. One answers how much; the other answers who, what and when.
Engineering leaders want to know whether agents, sessions, actions and AI runs are being used and whether they succeed, and security and compliance reviewers need evidence of who changed what. Assembling that from terminals, chat history and scattered logs is slow and incomplete. The concept keeps both views in the Insights section, drawn from the same record of workspace events.
The analytics illustration opens with a toolbar to pick a date range and a time grouping, refresh and filter, followed by tabs for Overview, Agents, Sessions, Sandbox, Vibes, Actions, VibeDeck, AI Events, Audit and Docs. The overview is a grid of metric tiles covering agents, targets, sessions, vibes, actions with a success rate, executions with an average duration, AI events, webhooks, vibe decks, audit log entries and docs, with small bar charts among them and Export CSV and Print buttons. The audit illustration adds a retention notice, summary cards for total, successful and failed entries and the retention period, filters for action, resource, status, agent and vibe, a Commands only toggle, and a selectable table of events with time, action, resource, name, actor, status and row actions, plus an Export button.
Together the two screens are designed to close the loop on governance. A jump in activity on the analytics page can be traced to the individual entries behind it, including denied operations and warnings, and both views can be exported for a review. Because every agent, session and vibe belongs to a workspace, the trail is meant to cover people, apps and agents alike.
What this concept shows
- Date range, time grouping, refresh and filter controls with a query-time indicator
- Tabs that break analytics down by agents, sessions, sandbox, vibes, actions, decks, AI events, audit and docs
- Metric tiles for agents, targets, sessions, vibes, actions, executions, AI events, webhooks, decks, audit logs and docs
- Success rate on action tiles and average duration on the executions tile
- Export to CSV and print from the analytics overview
- Audit summary cards for total, successful and failed entries and the retention period
- Audit filters by action, resource, status, agent and vibe, plus a commands-only toggle
- Event table with time, action, resource, name, actor type and status, bulk selection and export
How it works
- Open Analytics under Insights, choose a date range and grouping, and read the overview tiles.
- Switch tabs to break usage down by agents, sessions, actions, AI events or another area.
- Export the figures to CSV or print them for a review.
- Open the Audit Log to see total, successful and failed entries and the retention window.
- Filter the events by action, resource, status, agent or vibe, or show commands only.
- Open an entry for its detail, or export the trail for the period under review.
Who it's for
- Engineering managers tracking adoption of agents and automation
- Security and compliance reviewers who need a record of operations
- Platform teams checking action success rates and failures
- Workspace administrators managing retention and exports
Illustrations
2 illustrations of this concept. Select one to view it full size.
Analytics Overview with Metric Tiles
This illustration shows the Analytics page under Insights inside a framed application window. Beneath a purpose banner, a toolbar sets the date range to the last seven days and the grouping to day, with Refresh and filter buttons and a small indicator of how long the query took. A row of tabs switches between Overview, Agents, Sessions, Sandbox, Vibes, Actions, VibeDeck, AI Events, Audit and Docs. The Overview tab has Export CSV and Print buttons and a grid of tiles: agents with how many are active, targets with their connections, sessions with how many are running, vibes with how many have an agent, actions with a success rate, executions with an average duration, AI events, webhooks with how many are active, vibe decks, audit log entries and docs with a page count. Two tiles hold small bar charts of activity. All figures are sample data.
Audit Log of Workspace Operations
This illustration shows the Audit Log page under Insights, described as a comprehensive trail of all operations, with an Export button in the header. A notice explains that entries are kept for 90 days and older ones are purged automatically on a schedule. Four summary cards report total logs, successful entries, errors and failures, and the retention period. Below, a search box and dropdown filters for action, resource, status, agent and vibe sit beside a Commands only checkbox. The table starts with a selection column, a count of selected rows and a Delete Selected button, then shows columns for time, action, resource, name, actor and status. Sample rows show a user creating terminal sessions, an app executing a command on an agent, a denied attempt to delete a vibe and an idle agent flagged with a warning. Each row ends with a menu, a delete icon and a chevron that opens its detail.
Topics
- developer platform analytics
- agent usage analytics
- audit log for developer tools
- audit trail of operations
- audit log export
- AI usage tracking
- action success rate
- workspace activity report
- who did what audit log
- CSV export analytics
Related concepts
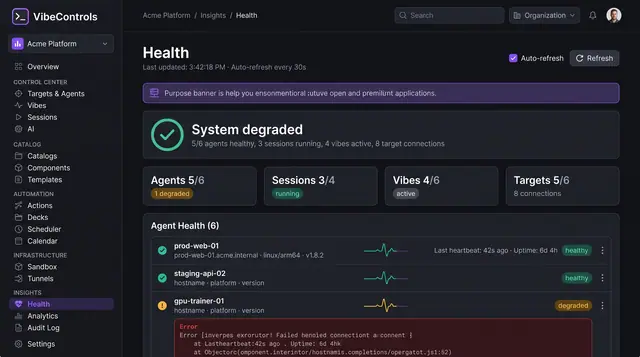
Fleet Health and Live Logs
See which agents, sessions, vibes and targets are healthy, then stream a struggling agent's logs to find out why.
2 illustrations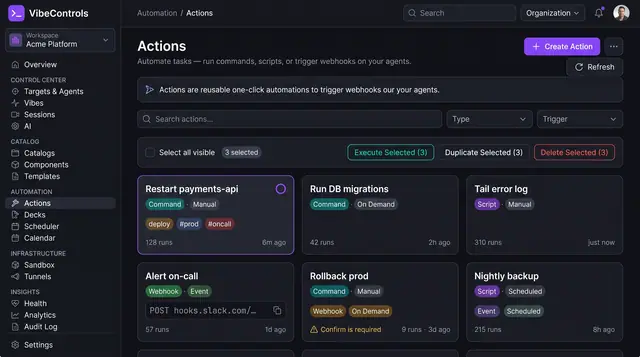
Actions and One-Click Ops Decks
Turn commands, scripts and webhooks into reusable actions, then pin them to one-click decks your team and on-call rotation can run.
3 illustrations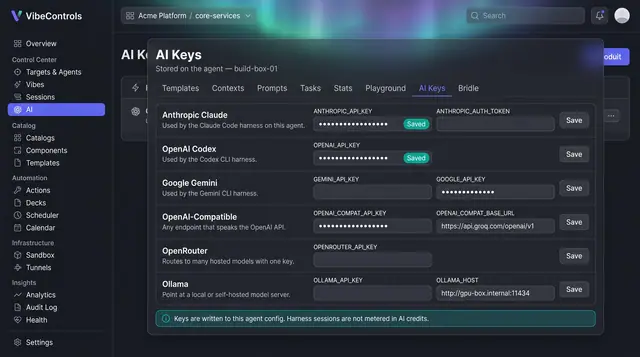
AI Provider Keys, Autonomy and Credits
Bring your own model keys, set how much each agent may do on its own, and see AI credit use before every message.
3 illustrations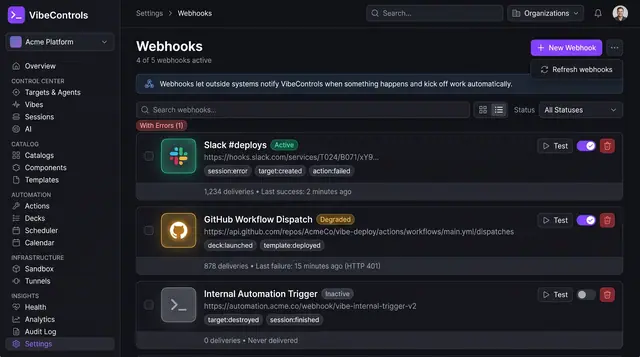
Webhooks and Event Subscriptions
Send signed notifications to chat, CI and your own services when agents, sessions and vibes change, and see which deliveries fail.
2 illustrations