
Targets and Agent Mesh Topology
Register the machines your agents can reach over SSH or directly, and see the agent-to-agent mesh as an interactive graph.
These images are illustrations of the concept, not screenshots of the actual product.
Overview
In VibeControls, a target is a machine where work runs: a laptop, a VM, a remote server or a container host. Targets can be reached directly or over SSH, often through another agent acting as a relay. This concept covers how the design models those machines and the paths between them, across three views: the Targets list, a single target's detail page and the Agent Graph.
Real fleets are rarely flat. A production server may only be reachable through a jump host, a database box may sit on a private network, and a legacy machine may drop off without anyone noticing. The concept makes those relationships explicit. The Targets list shows each machine's connection type, whether it is connected, whether an agent is installed, the user, host and port it is reached on, which agent it is reached via, and its labels. Every row carries actions to test the connection, open a terminal, install an agent, or edit, uninstall and delete the target.
The target detail illustration focuses on one machine: an identity card with name, type, status, host, username, port, last-updated time and labels; a tag picker; an activity chart; the agents installed on that target with version and status; and the inbound connections that reach it, such as an SSH relay from a developer laptop. Share and Back actions sit in the header.
The Agent Graph then zooms out to the whole mesh. It draws agents as nodes and connections as directed links, starting from a personal laptop agent and fanning out through shared agents over SSH and direct links, several hops deep. A summary counts agents and links, a scope selector narrows the view, a legend explains the status colors, and actions let you request a mesh connection or deploy a new agent. Together, the three views are designed to answer the question every operator eventually asks: what can reach what, and through which path.
What this concept shows
- Targets list with SSH or DIRECT type, connected or disconnected state and an agent-installed badge
- Connection details per target, including user, host, port and the agent it is reached through
- Row actions to test, open a terminal, install an agent, and edit, uninstall or delete a target
- Filters for status, connection type and agent, with grid and list layouts
- Target identity card with labels, a tag picker and an activity chart
- Lists of agents installed on a target and inbound connections such as SSH relays
- Agent Graph that draws the agent-to-agent mesh as directed, multi-hop links with status and link type
- Mesh request and Deploy Agent actions with a scope selector and a status legend
How it works
- Open Targets & Agents and switch to the Targets tab to see how many machines are connected.
- Filter by status, type or agent, then test a connection or open a terminal from a target's row.
- Install an agent on a target that does not have one yet, or edit, uninstall or delete targets you no longer need.
- Open a target to review its identity, labels, installed agents and the inbound connections that reach it.
- Switch to the Agent Graph to see the full mesh, narrow its scope and trace multi-hop paths between agents.
- Request a new mesh connection or deploy an agent where the graph shows a gap.
Who it's for
- DevOps and platform engineers managing staging, production and customer servers
- Developers working across a laptop, remote VMs and private-network machines
- Infrastructure leads who need to know what reaches what
- Research and HPC teams coordinating access to shared compute
Illustrations
3 illustrations of this concept. Select one to view it full size.
Targets List with Connection Status
This illustration shows the Targets tab of Targets & Agents. The heading reports how many targets are connected out of the total, beside a refresh button and an Add Target button, and a banner explains that a target is a machine your agents can reach. A toolbar offers target search, grid and list layouts, and filters for status, connection type and agent. Each row starts with a type badge, SSH or DIRECT, and a connection pill, with one sample legacy server shown as disconnected in red. The row then gives the target name, a short label, an Agent Installed badge, the user, host and port it is reached on, the agent it is routed via, and tag chips such as prod, web, db, edge and cache. On the right, Test and Terminal buttons, an Install Agent button on some rows, and a menu offering Edit, Uninstall and Delete.
Target Detail: Identity, Agents and Connections
This illustration shows the detail page for one sample production web server, reached through a breadcrumb from Targets & Agents and Targets. The header names the machine and its SSH connection type, with Share and Back buttons. An Identity card lists the name, type and a connected status pill, followed by host, username, SSH port and a last-updated timestamp, with labels such as prod, web and edge. A Tags card offers a tag picker with removable chips. On the right, a data visualization panel shows a stacked bar chart of activity. An Agents on this target panel, with an All agents link, lists two agents with their versions and statuses, one Active and one Degraded, plus a link to open the agent. An Inbound connections panel shows an SSH relay arriving from a developer laptop, marked connected.
Agent Mesh Topology Graph
This illustration shows the Agent Graph tab, titled Agent Mesh, for visualizing and managing the agent-to-agent mesh. The header offers a Mesh request button and a Deploy Agent button, and a status bar carries a legend for online, warning, offline and idle states. A panel header summarizes the number of agents and links and includes a scope dropdown set to all agents. On a dotted canvas, a highlighted personal agent on a developer laptop sits at the left and connects through curved arrows to shared agents on production and staging servers, which in turn link to further agents one and two hops away. Each node card shows a robot icon, the agent name, its version, a colored status dot, whether it is personal or shared, and a badge for the link type, SSH or DIRECT. One staging node carries an amber warning dot.
Topics
- SSH target management
- remote machine inventory
- agent mesh topology
- agent-to-agent network graph
- jump host relay
- multi-hop SSH connections
- connection testing
- install agent on server
- fleet topology visualization
- direct and SSH targets
Related concepts
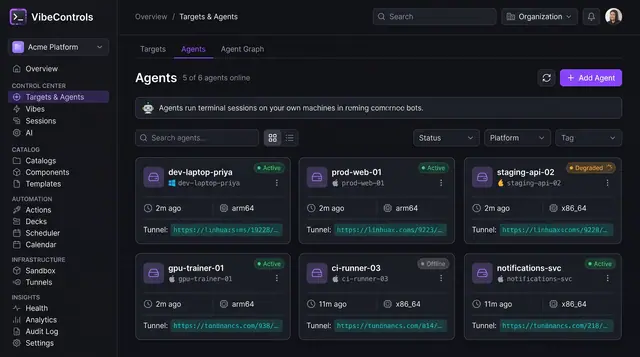
Agent Fleet and Agent Detail
See every agent's status, platform and tunnel at a glance, then drill into one agent to manage its plugins, sessions and logs.
2 illustrations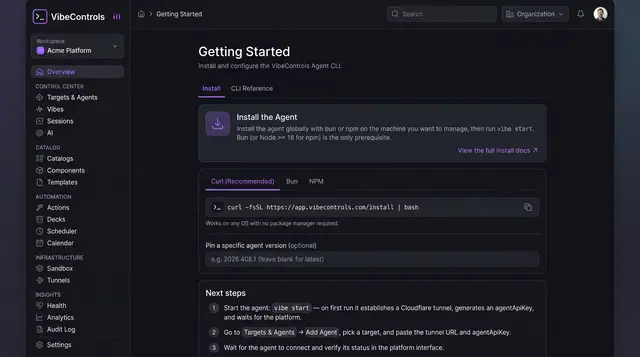
Install and Connect Your First Agent
Install the agent with one command, start it, and connect it to your workspace in a short guided two-step flow.
2 illustrations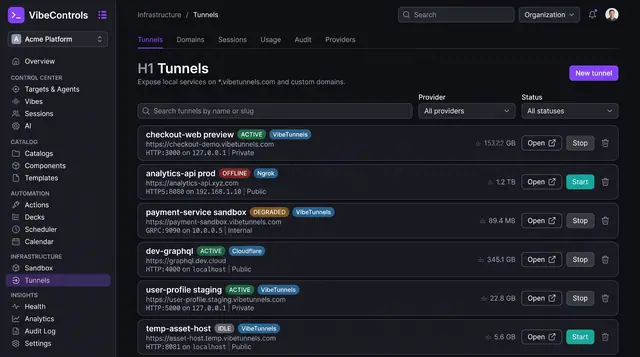
Managed Tunnels for Local Services
Publish a service running on any agent's machine at a managed URL, decide who can reach it and watch its traffic live.
3 illustrations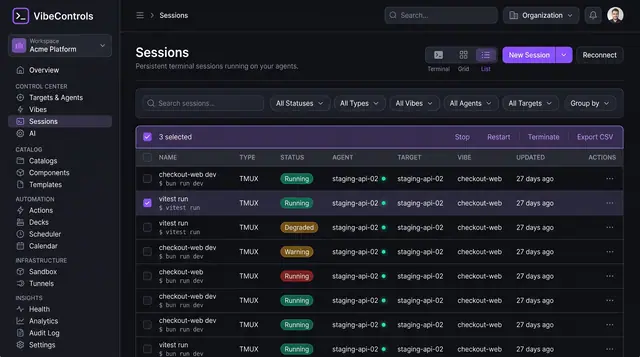
Persistent Browser Terminal Sessions
Keep long-running terminals alive on your own machines, then find, watch and control them from any browser.
2 illustrations