
Fleet Mission Control Overview
One home screen for every agent, session, project and AI run in your engineering fleet, on desktop or on your phone.
These images are illustrations of the concept, not screenshots of the actual product.
Overview
The fleet mission control overview is the concept for the first screen a VibeControls user sees after signing in. It answers the questions a developer or platform lead asks at the start of the day: which agents are online, what is running right now, how healthy the machines are, and how much AI work the fleet has done. Instead of opening terminals on several machines or checking a handful of dashboards, the design brings those signals into one workspace-scoped view.
The problem it addresses is fragmentation. Teams that run coding agents across laptops, staging servers, GPU boxes and CI runners usually track them through SSH sessions, chat messages and memory. The overview concept treats the whole set of machines and agents as one fleet, so you can spot an offline runner or a degraded trainer at a glance and act on it without leaving the page.
On desktop, the illustration pairs a row of headline counters (active agents, live sessions, vibes and AI runs today) with a fleet activity chart, a fleet health panel that lists machines with online, degraded and offline states, a recent sessions table and a column of quick actions. A dismissible getting-started banner tracks onboarding progress for new workspaces. The mobile illustration condenses the same picture into a phone layout with four stat tiles, a short list of active agents, a recent activity timeline and running sessions, so you can check on long jobs away from your desk.
The overview is designed as the jumping-off point for the rest of the product. Every panel leads somewhere deeper: agent cards to agent detail, sessions to the browser terminal, vibes to project workspaces, and quick actions to creating sessions, adding agents, building workflows or scheduling tasks. The full navigation for Control Center, Catalog, Automation, Infrastructure and Insights stays visible in the sidebar, so the overview works as a hub rather than a dead end.
What this concept shows
- Headline counters for active agents, live sessions, vibes and AI runs in the current day
- Fleet activity area chart with a selectable time window
- Fleet health gauge with per-machine online, degraded and offline status pills
- Recent sessions table showing task, agent, target, status and start time
- Quick actions to start a session, add an agent, review vibes, create a workflow or schedule a task
- Dismissible getting-started banner that tracks onboarding steps
- Phone layout with stat tiles, active agents, a recent activity timeline and running sessions
How it works
- Open the overview to see the getting-started progress and the headline counters for the workspace.
- Scan the fleet activity chart and the fleet health panel to find machines that are degraded or offline.
- Check the recent sessions table to see which agents are running builds, tests or training jobs and on which targets.
- Use a quick action to start a new session, add an agent or schedule a task directly from the overview.
- On the go, open the mobile overview to glance at stat tiles, active agents and running sessions and tap into any item.
Who it's for
- Developers running coding agents across several machines
- Platform and DevOps engineers responsible for fleet uptime
- Engineering leads who want a daily view of agent and AI activity
- Freelancers and consultants juggling many client environments
Illustrations
2 illustrations of this concept. Select one to view it full size.
Fleet Overview Dashboard on Desktop
This illustration shows the desktop overview inside the full application shell. A left sidebar holds a workspace switcher and grouped navigation for Control Center, Catalog, Automation, Infrastructure and Insights, with Settings at the bottom. The top bar carries a breadcrumb, search, an organization selector and notifications. Under the page title, a dismissible banner tracks getting-started progress. Four counter cards follow: active agents out of the total, live sessions with a small sparkline, the number of vibes, and AI runs today, highlighted as the key figure. A large fleet activity chart plots two overlapping series over a selectable window, set here to the last 24 hours. Beside it, a fleet health panel shows an overall healthy percentage ring and a list of sample machines tagged online, degraded or offline. Below, a recent sessions table lists session, agent, target, status and start time, and a quick actions column offers New Session, Add Agent, Review Vibes, Create Workflow and Schedule Task.
Fleet Overview on a Phone
This illustration shows the overview reworked for a phone. The header has a menu button, the product mark and an initials avatar, followed by a search field for assets, agents and sessions. Under the page title, a two-by-two grid of stat tiles reports targets with how many are connected, agents with how many are active, vibes with how many are active, and sessions with how many are running, each with its own icon. An Active Agents section with a View all link lists agent cards showing the agent name, the host it runs on, a green online dot and the operating system and CPU architecture. A Recent Activity timeline records events such as a session starting, an agent coming online and a job completing, each with a relative time. A Running Sessions card at the bottom pairs a project with its agent, a Running badge and a session identifier. All names and counts are sample data.
Topics
- agent fleet dashboard
- developer mission control
- coding agent monitoring
- fleet health overview
- AI runs dashboard
- terminal session overview
- mobile developer dashboard
- multi-machine development overview
- internal developer platform home
Related concepts
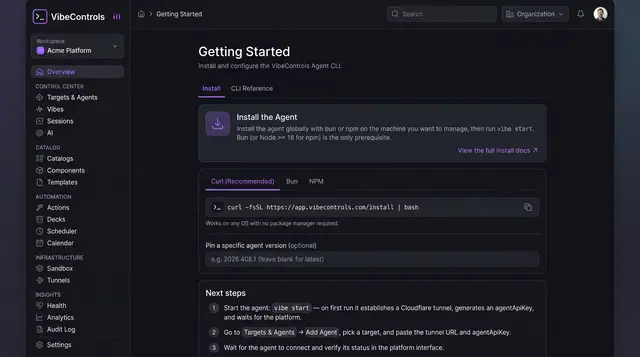
Install and Connect Your First Agent
Install the agent with one command, start it, and connect it to your workspace in a short guided two-step flow.
2 illustrations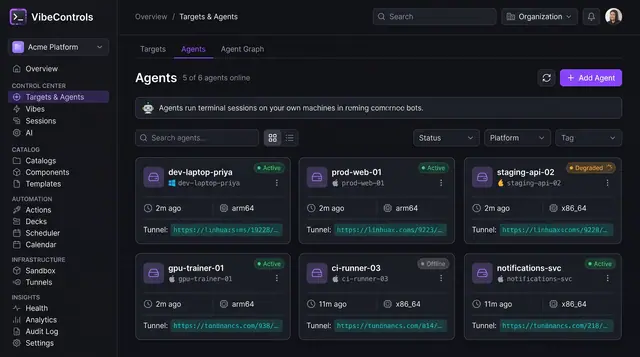
Agent Fleet and Agent Detail
See every agent's status, platform and tunnel at a glance, then drill into one agent to manage its plugins, sessions and logs.
2 illustrations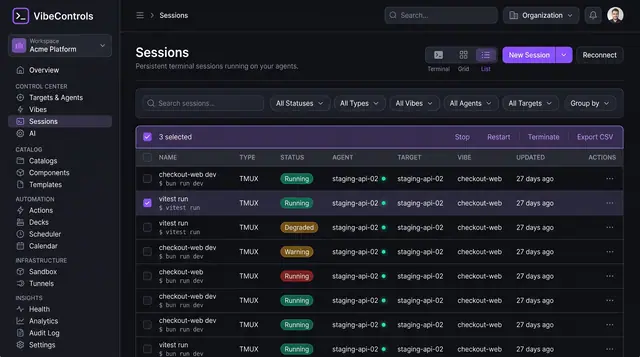
Persistent Browser Terminal Sessions
Keep long-running terminals alive on your own machines, then find, watch and control them from any browser.
2 illustrations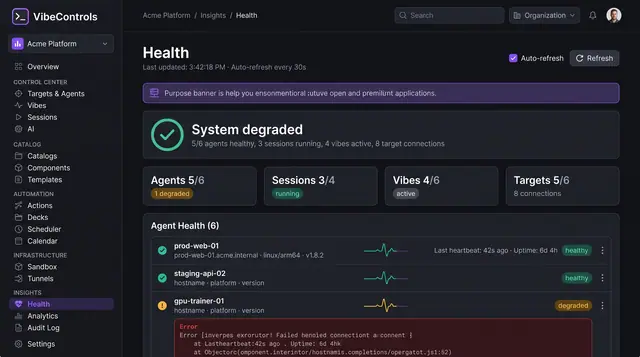
Fleet Health and Live Logs
See which agents, sessions, vibes and targets are healthy, then stream a struggling agent's logs to find out why.
2 illustrations