When you're managing machines across a VPC, a home network, a cloud provider, and a contractor's laptop, "can A reach B?" becomes a daily debugging question. Most teams answer it by SSHing around and hoping for the best.
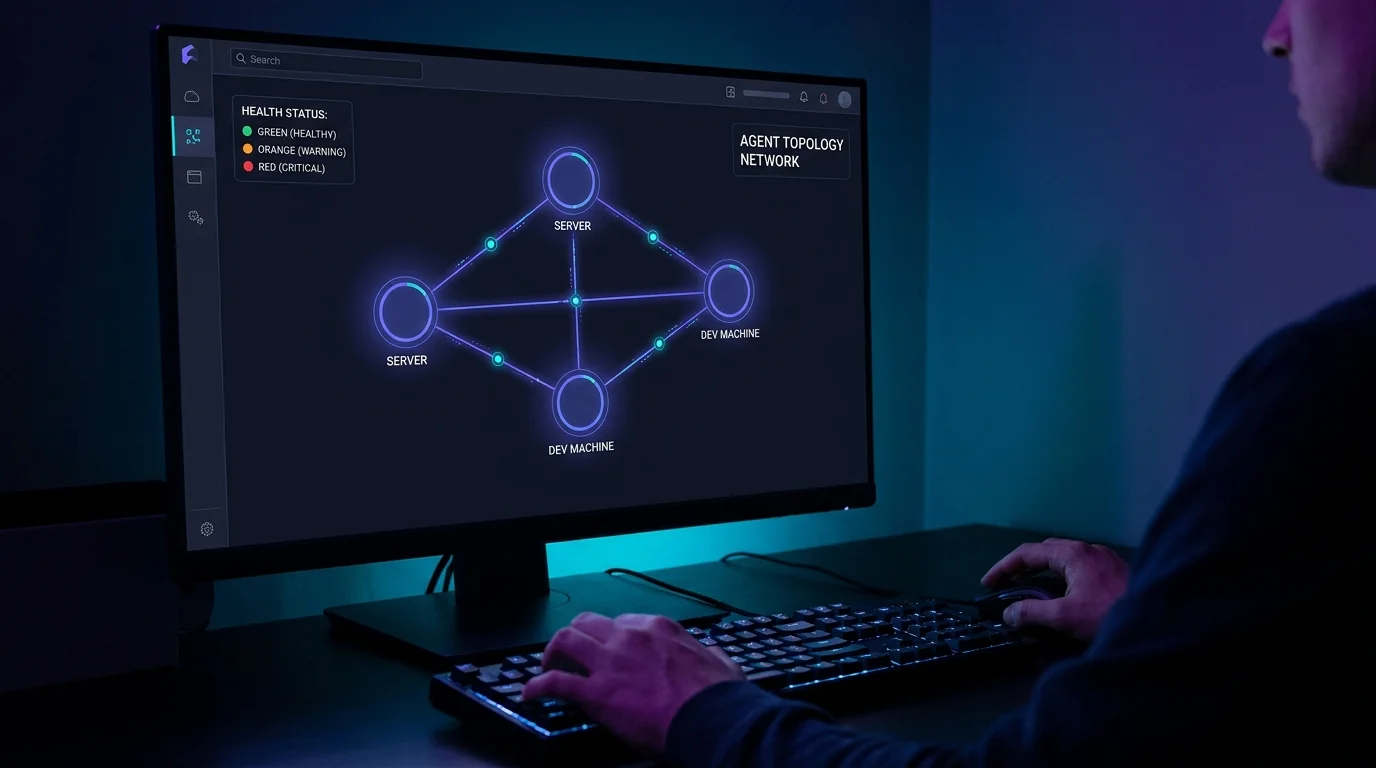
VibeControls' Agent Graph gives you a persistent topology view. The graph plots every registered target and agent as a node, with directed edges for the mesh connections you have configured between them. Node labels show the saved target and agent status, while edge selection exposes the connection permissions and scopes.
You can see which agents have a configured path to your staging database versus which do not. From a node, you can open a mesh request — VibeControls validates the reachable root and every authorized hop before proxying the requested command or API call to the destination.
For incident response, the topology view is the first place to inspect your configured relationships and the latest displayed node status. Pairwise latency probes and automatic live connection-status updates are not currently controls in this graph.
Do it yourself
Map registered targets, agents, and configured mesh connections, adjust connection permissions, and send a validated request through an authorized mesh path.
Go to the Agents page and click the Graph tab.
You should see: The mesh topology graph renders, showing your infrastructure at a glance.
Ready to make this your story?