
Scheduled Jobs and Calendar
See every scheduled job across your agents on one calendar, then open any job to check its schedule, run history and logs.
These images are illustrations of the concept, not screenshots of the actual product.
Overview
Scheduled jobs are the concept for the recurring work a fleet has to do without anyone watching: database backups, log rotation, vacuuming, certificate renewals and similar maintenance. In VibeControls, each job ties an action to a schedule and a target machine, and the calendar is designed to show all of them together so a team can see what runs where, and when.
Cron entries scattered across servers are easy to forget and hard to audit. Nobody sees the whole timetable, overlapping jobs collide, and a failed backup can go unnoticed for days. The design brings every schedule into one workspace view with status colors, so a failure shows up as a red entry on the calendar instead of as silence.
The first illustration is a month calendar with a Today button, previous and next controls, a switch between month, week, day and agenda views, and a Schedule Task button. Each day lists job chips named by job and target, marked green, amber or red, with a count of further jobs when a day is busy, and weekends are shaded. The second illustration opens one job, a nightly database backup on a production web server. Summary cards show the cron schedule, timezone, next and last execution, the executor with the action it runs, and a priority. An executions list records each run with its status, start and completion times and exit code, and a logs panel shows the captured output and run duration. An Execute Now button runs the job outside its schedule.
The calendar sits in the Automation section alongside actions, decks and the scheduler, so a job is designed to reuse the same actions that power one-click decks. Run results are meant to feed the fleet's health and audit views, giving on-call engineers and platform teams one place to confirm that routine maintenance actually happened.
What this concept shows
- Month calendar of scheduled jobs across agents, with month, week, day and agenda views
- Job chips labeled by job and target machine and colored by execution status
- Overflow counts on busy days and shaded weekends for quick scanning
- Schedule Task button to add a new recurring job from the calendar
- Job summary cards for cron schedule, timezone, next and last execution, executor, linked action and priority
- Execution history with completed and failed states, start and finish times and exit codes
- Logs side panel with captured standard output and run duration
- Execute Now to trigger a job on demand
How it works
- Open the calendar in the Automation section to see the month's scheduled jobs across all agents.
- Scan the status colors to spot failed or warning runs, and switch to week, day or agenda view for more detail.
- Select a job to open its detail page and review its cron schedule, timezone, next execution and priority.
- Check the executions list for failed runs and their exit codes, then choose View logs to read the output.
- Use Execute Now to rerun the job immediately, or Schedule Task on the calendar to add a new one.
Who it's for
- DevOps and platform engineers who own recurring maintenance
- Site reliability and on-call engineers who verify backups and renewals
- Database administrators tracking backup and vacuum jobs
- Engineering leads who need evidence that routine jobs ran
Illustrations
2 illustrations of this concept. Select one to view it full size.
Vibe Calendar Month View
This illustration shows the Calendar page in the Automation section, subtitled as the place to schedule and manage tasks across your agents. An info banner sits under the title. A toolbar holds a Today button, previous and next arrows, the month name, a segmented switch for month, week, day and agenda views, and a Schedule Task button. The month grid runs Sunday to Saturday, with weekend columns shaded and the current day highlighted. Each weekday cell lists compact chips that pair a job name with its target machine, such as a database backup on a production web server, a nightly vacuum for an ML pipeline, log rotation on a CI runner or a certificate renewal for an infrastructure project. Chips carry green, amber or red status dots, and busy days end with a count of further jobs. A few red entries, such as a backup on a GPU machine, stand out as failures. All jobs and dates are sample data.
Scheduled Job Detail with Run History
This illustration shows the detail page of a sample nightly database backup job on a production web server, reached through the calendar breadcrumb. The title carries a completed badge, and an Execute Now button sits at the top right. Six summary cards report the schedule type as cron with its expression, the timezone, the next and last execution times, the executor type with a reference to the action it runs, and a high priority. Below, an Executions list with a total count shows one row per run: a completed or failed badge, the start time, the completion time, an exit code chip and a View logs button. One failed run stands out with a nonzero exit code. A Logs panel on the right displays the selected run's standard output, tracing a database dump, the upload of the resulting archive with its size and a zero exit code, and ends with the run's duration.
Topics
- cron job dashboard
- scheduled jobs calendar
- server job scheduler
- backup job monitoring
- cron run history
- job execution logs
- scheduled tasks across servers
- maintenance calendar
- recurring task scheduler
- cron alternative for teams
Related concepts
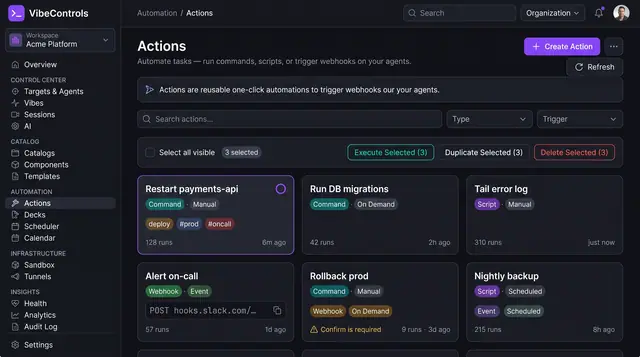
Actions and One-Click Ops Decks
Turn commands, scripts and webhooks into reusable actions, then pin them to one-click decks your team and on-call rotation can run.
3 illustrations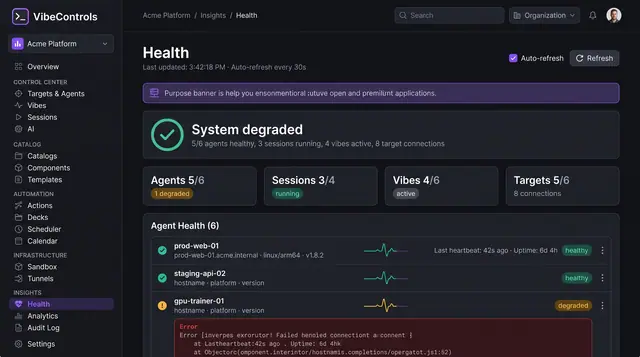
Fleet Health and Live Logs
See which agents, sessions, vibes and targets are healthy, then stream a struggling agent's logs to find out why.
2 illustrations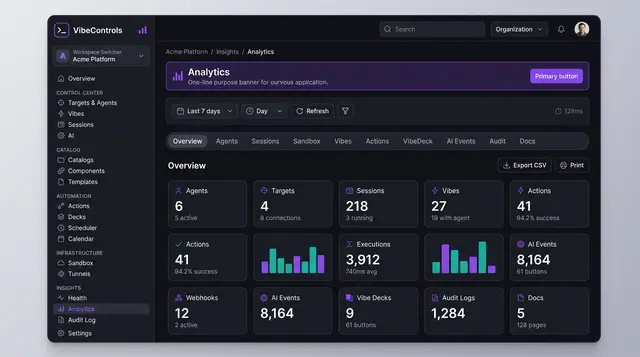
Usage Analytics and Audit Trail
Count what the fleet did over any period, then drill into a searchable record of who did what, where and with what result.
2 illustrations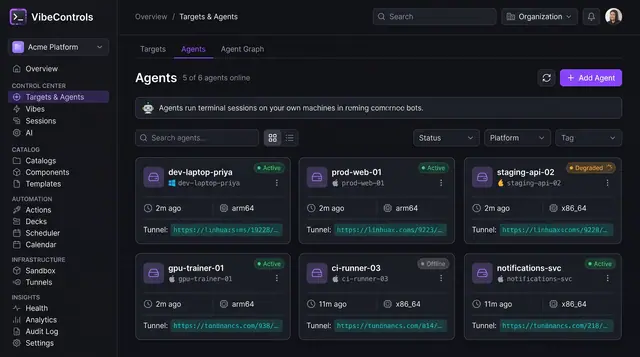
Agent Fleet and Agent Detail
See every agent's status, platform and tunnel at a glance, then drill into one agent to manage its plugins, sessions and logs.
2 illustrations